PCBA Cost Optimization: Key Factors and Best Practices
Printed circuit board assembly is where most of an electronic product’s manufacturing value is created, and where most of its cost is locked in. PCBA cost optimization means reducing assembly cost through design improvements, smarter supply chains, and better production processes, without compromising quality or performance. In a competitive market, saving even a few dollars per unit can transform the profitability of a project. Depending on the design and scale, structured optimization typically reduces assembly costs by 10 to 40 percent, which is why leading hardware teams treat cost engineering as a core discipline rather than a negotiation exercise.
Understanding the PCBA Cost Structure
To optimize cost, teams must first understand where money goes. Components normally represent 60 to 70 percent of total PCBA cost, which makes component selection the single most powerful lever. Standard resistors cost roughly USD 0.002 to 0.01 each, mid-range microcontrollers USD 1.50 to 3.00, and high-end specialized ICs USD 10 to 20 or more. Choosing common, active parts instead of scarce or obsolete ones is the first and most reliable saving, and consolidated volume purchasing typically cuts component prices by a further 15 percent.
The remaining cost splits between the bare board, assembly labor, and testing. Each of those areas responds to different levers: board cost falls with simpler stack-ups, assembly cost falls with SMT-friendly design, and test cost falls with testability planning. Because the four areas interact, the best results come from optimizing the whole chain rather than squeezing a single line item.
How PCB Design Drives Assembly Cost
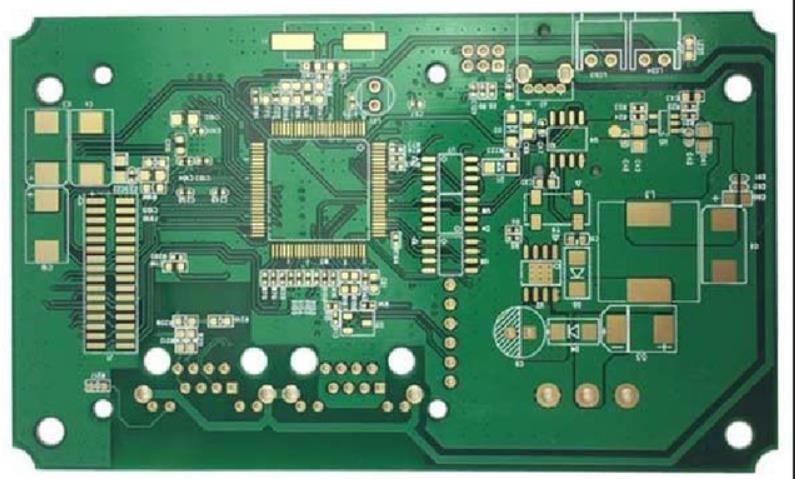
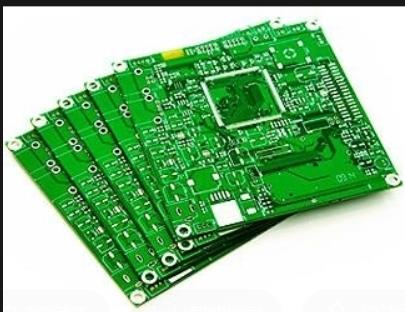
Board design determines much of the assembly bill before a single component is bought. A two-layer FR-4 board costs about USD 0.10 to 0.30 per square inch, a four-layer board USD 0.50 to 1.20, and high-frequency Rogers boards USD 2.00 to 4.00. Reducing unnecessary layers, vias, and board area directly lowers fabrication cost, and it also improves yield, which quietly reduces assembly losses as well.
Design choices also affect assembly efficiency. Generous pad sizes, consistent package orientation, adequate spacing, and standardized footprint families let placement machines run faster with fewer nozzle changes. Fiducial marks and panelized layouts improve registration and throughput. These details are the essence of design for manufacturability, and they cost nothing to implement but save money on every single board produced.
Assembly Technology and Its Cost Impact
The assembly process itself carries a well-known cost structure. SMT placement runs about USD 0.01 to 0.03 per component at volume, while through-hole insertion costs USD 0.05 to 0.15 per joint because it is more labor-intensive. Mixed-technology boards that combine SMT and THT usually cost 10 to 20 percent more than pure SMT designs, so consolidating through-hole parts into surface-mount equivalents is one of the fastest ways to cut assembly cost.
Beyond component count, line utilization matters. Small batches pay for changeovers and setup repeatedly, while larger, well-sequenced orders amortize those costs. Panelizing multiple boards and combining several products into one assembly run improves utilization and lowers the per-unit price. Suppliers with modern high-speed lines offer lower per-placement rates, which is why many companies review their SMT PCB assembly partners when production volumes grow.
Labor Cost and Manufacturing Location
Where assembly happens strongly influences price. SMT placement in the US or Europe typically costs USD 0.08 to 0.15 per component, while equivalent placement in China runs USD 0.01 to 0.05. That gap explains why many hardware companies outsource volume assembly to Asia, and it remains one of the largest single savings available to cost-conscious teams.
Location decisions should include the full landed cost rather than placement rates alone. Freight, duties, communication overhead, and risk of delay all belong in the comparison. Many teams use a hybrid model: prototypes and sensitive early builds stay near the design team, while volume production moves to an offshore partner with mature quality systems. The saving per unit is large enough that even with logistics added, offshore assembly usually wins for high-volume consumer and industrial products.
Testing and Quality Assurance Costs
Testing is essential but can be optimized. Basic in-circuit test typically costs USD 0.02 to 0.05 per test point, and functional test runs USD 0.50 to 2.00 per unit depending on complexity. When test access is designed into the board from the start, testing runs faster and catches defects where they are cheapest to fix. Poor test planning, by contrast, forces operators to probe awkward points, adds USD 0.10 to 0.50 per unit, and lets defects slip to later stages where they are far more expensive.
Quality strategy should balance coverage against cost. Flying probe testing suits prototypes and small batches because it needs no fixture, while ICT with bed-of-nails fixtures pays off at higher volume. AOI catches placement and soldering defects optically, and X-ray covers hidden BGA joints. The right mix depends on product risk and volume, and a good PCBA testing program documents the trade-offs clearly so buyers can choose coverage consciously rather than by default.
Best Practices in PCBA Cost Optimization
Proven practices consistently deliver results. Design for manufacturability and testability comes first: fewer via types, unified package families, and test points on every net reduce both production and test effort. Supplier management comes second, where long-term relationships and consolidated orders cut component costs by 5 to 15 percent. Component standardization across projects lowers inventory pressure and purchasing risk, often saving up to 20 percent on procurement overhead.
Automation and data-driven production add a further layer. Automated assembly reduces manual labor, and AI-assisted production and supply-chain planning can shorten assembly time by 10 to 25 percent, worth USD 0.01 to 0.05 per unit in large projects. None of these practices requires a design sacrifice; they are process and planning improvements that compound across every batch.
Common Mistakes That Inflate PCBA Cost
Cost problems usually come from a small set of avoidable errors. Over-design is the most common: moving from a four-layer to a six-layer board adds USD 0.40 to 0.80 per square inch without necessarily improving the product. Using scarce or discontinued components is the most expensive, because obsolete ICs can cost 300 to 500 percent more than a modern replacement with equivalent function. Ignoring test planning pushes cost into operations, and skipping early cost analysis leads to rework that raises batch cost by 15 to 30 percent.
Each mistake traces back to a decision made before the first order was placed. Reviewing the stack-up, component availability, and test strategy at design time is nearly free; fixing them after production starts is not. Teams that formalize a cost review at the design gate consistently avoid the most expensive errors.
A Realistic Example of PCBA Cost Saving
A wearable-device company illustrates how the levers combine. Before optimization, its PCBA cost was about USD 18.50 per unit. Moving from a six-layer to a four-layer board saved USD 2.00; replacing a scarce IC with a standard alternative saved USD 3.50; shifting SMT assembly from the US at USD 0.12 per placement to China at USD 0.03 saved USD 4.00; and improving the DFT test strategy saved USD 1.50. The result was a unit cost of USD 12.95, a 30 percent reduction, achieved without changing the product’s function or quality.
The example shows that no single action delivers the full saving. Board design, component selection, manufacturing location, and testing each contributed a slice, and the total came from optimizing them together. Companies that replicate this pattern review all four areas on every new product instead of optimizing only the largest line item.
Transparent quotations make optimization possible. Buyers should ask suppliers to itemize component, board, assembly, and test costs so that savings can be tracked to their source. When a quote hides the breakdown, engineers cannot tell whether a price reduction came from a better process or from thinner inspection, and quality decisions become guesswork. Reliable partners publish their rate structures, flag specification changes that affect cost, and explain yield assumptions. This transparency also supports the annual cost-reduction reviews that mature companies run with their manufacturing partners, where last year’s bill of materials is re-examined against new components, new volumes, and new process options. Over several product generations, such reviews typically double the savings available from any single redesign.
Procurement Strategy as a Cost Lever
Components dominate cost, so procurement deserves engineering attention. Buyers should verify that every part is available from at least two sources, check lifecycle status, and consolidate orders across projects to reach volume price breaks. Authorized distribution and early supplier engagement reduce the risk of counterfeit parts and last-minute substitutions, both of which destroy cost predictions.
For many companies, the practical answer is a partner that combines component sourcing with assembly. Services that manage procurement against an approved vendor list, verify parts on arrival, and feed shortage warnings back to the design team remove a whole layer of risk. A structured components procurement process turns purchasing from a reactive scramble into a planned part of the product plan.
Future Trends in PCBA Cost Optimization
The next wave of cost improvement comes from smart manufacturing. Industry 4.0 factories reduce human error and can cut labor-related cost by about 20 percent through connected equipment and digital work instructions. AI-driven supply chains forecast component demand, avoid shortages, and optimize order timing, while green manufacturing with lead-free processes and recyclable materials reduces long-term waste and compliance exposure, even when initial cost is slightly higher.
Data is the common thread: factories that measure placement accuracy, yield by defect type, and test fallout can target improvements precisely. As these capabilities become standard, the competitive gap between optimized and unoptimized production widens, making cost engineering a permanent part of electronics development rather than a one-time exercise.
PCBA Cost Optimization FAQ
Q1: How much can PCBA cost optimization save? Depending on project scale and design complexity, typical savings range from USD 3 to 8 per unit, or 10 to 40 percent of total assembly cost.
Q2: Is offshore assembly always cheaper? In most cases yes for volume production, with Chinese SMT placement at USD 0.01 to 0.05 per component versus USD 0.08 to 0.15 in the US or Europe, but freight, duties, and risk must be included in the comparison.
Q3: How much does PCB design affect cost? Substantially. A well-planned four-layer design can save USD 1 to 2 per unit versus an unnecessary six-layer board, before considering yield improvements.
Q4: Can small batches benefit from cost optimization? Yes. Standardizing components and consolidating orders for runs of 500 units or more typically lowers unit cost by USD 2 to 4 even at small scale.
Q5: What is the first step in optimizing PCBA cost? Perform a structured review at the design stage covering stack-up, component availability, assembly technology, and test strategy, because changes are cheapest before the layout is finalized.
Conclusion
PCBA cost optimization is not about cutting corners; it is about making intelligent choices in design, sourcing, manufacturing, and testing that protect quality while removing waste. Components, board design, assembly location, and test coverage each offer measurable savings, and the best results come from optimizing them as one system. With PCB design layout reviews, disciplined procurement, and a manufacturing partner that documents yield and cost data, hardware teams routinely achieve 10 to 40 percent reductions that flow straight to the bottom line. Products succeed in the market when they combine strong performance with a cost structure that supports growth, and cost optimization is exactly how that combination is built.