




First Pass Yield and the Metrics That Support It
A yield number on its own says almost nothing. Ten percent of boards failing at final test could mean a stable process with a tight limit, or a process that has been degrading for a month, or a test fixture that has started to produce false calls. The value of a yield figure comes from the way it is counted, the station it belongs to, and the deflator that sits beside it. Choosing those three things well turns a number that provokes an argument into a number that directs work.
Why a Single Yield Number Misleads
A final test yield flattens the whole line into one figure. Rework at an intermediate station raises the final yield while adding cost, so a line that reworks heavily looks healthier than a line that does not. Conversely, a line that scrapped a defective board before final test would show a higher final yield and a lower total output, which is the opposite of what happened.
The figure also depends on when it is measured. A board that was touched up before final test is counted as a pass, and a board that failed and was later repaired is counted as a fail at the moment of failure but not in the final figure. Both conventions exist, and both are defensible; what is not defensible is using one for the daily report and the other for the monthly one, which is how yield figures become a subject of dispute rather than a source of information.
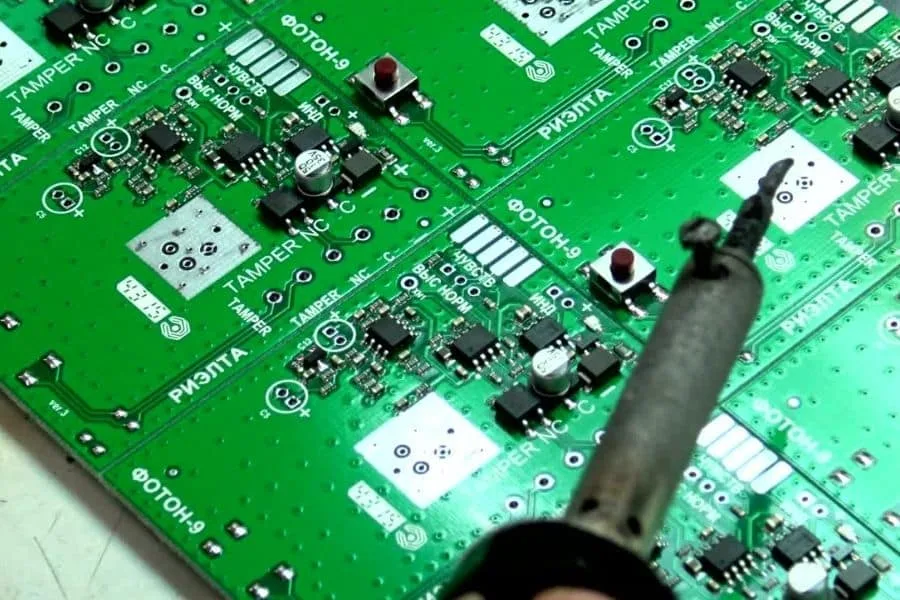
<img src="https://www.gopcba.com/wp-content/uploads/2026/08/1.webp" alt="Dashboard showing first pass yield and roll throughput yield by station” />
First Pass Yield and How It Is Counted
First pass yield counts only the units that passed at the first attempt, with no rework at any station before the point of measurement. That makes it the honest measure of process capability, because it cannot be improved by repairing anything. To be comparable between products it has to be tied to a defined station, and the stations that matter most are the ones after which the value of the board is high enough that rework is expensive.
Counting it correctly requires the rework to be recorded at the station where it happened, not at final test. Where an operator replaces a component and does not record it, the first pass yield is overstated and the defect pareto loses that defect entirely. The recording discipline is therefore part of the metric, and a station that does not record its rework cannot contribute to a meaningful figure. The first pass yield definition should be written down and applied consistently, with the station list and the rework rules attached to it.
Roll Throughput Yield Across Stations
Roll throughput yield multiplies the first pass yield of each station together, so it gives the probability that a board passes every station without rework. For four stations at 99 % each, the roll throughput yield is about 96 %, which is the figure that reflects how much rework the line actually performs. It is more useful than the average of the station yields, because averaging hides the compounding effect.
The metric also identifies where improvement pays most. Since the yields multiply, the lowest station dominates, but improving a station from 99 % to 99.9 % still moves the product meaningfully when there are several stations. Ranking stations by the product of their yield and the volume through them shows which one to work on. The first pass yield analysis method provides the structure for that ranking.
Defect Pareto and Its Limits
A defect pareto ranks defect codes by frequency, and it is the fastest way to find the largest single cause of loss. Its limit is that frequency is not the same as cost. A hundred cosmetic scratches and five missing components will be ranked in that order, and the missing components are the ones that reached the customer if they escaped. Pareto should therefore be produced in two forms, by count and by severity-weighted count, with the weights agreed in advance.
The codes themselves matter. A scheme with fifteen codes, several of which overlap, produces a pareto that no one can act on because the largest bar is ambiguous. A scheme with five or six codes that map one-to-one onto a process step gives a pareto where the largest bar points at a machine or a material. The code list should be reviewed whenever a new failure mode appears, and the mapping from code to process step should be documented. Tracking the top three codes over time is more useful than tracking the total, because the total moves for reasons that have nothing to do with the process.
DPPM and the Customer View
Defective parts per million is the unit the customer uses, and it counts the escapes that reach them rather than the defects caught internally. A line with a 96 % first pass yield can have a very low DPPM if its test coverage is good, and a line with a 99.5 % first pass yield can have a poor DPPM if its final test misses a failure mode. The two metrics answer different questions and both are needed.
DPPM is also the metric that most often changes behaviour, because it is measured at the customer and therefore cannot be redefined. Where the internal metrics and the DPPM disagree, the disagreement itself is informative: it means that defects are being caught and reworked internally at a rate that the customer never sees, which is fine, or that they are escaping, which is not. Comparing the escape rate against the internal detection rate for each defect code shows which.
Downtime and Availability as Yield Inputs
Line downtime affects yield in a way that is easy to miss. A stop-and-restart at the printer produces a first article that may not be representative, and a feeder change produces a small number of placements at a different pick position. Where downtime is recorded only in hours, the yield effect is invisible; where it is recorded against the station and the reason, the yield change after each event can be measured.
Availability and yield should therefore be reviewed together. A line with 95 % availability and 98 % first pass yield may be losing more to the interaction between them than to either separately. Recording the first boards after each restart as a separate sub-lot, and comparing their yield with the rest of the shift, makes the interaction visible without any extra equipment. The manufacturing yield review is the place where both are normally considered.
Data Collection: What the Machines Already Know
Most of the data needed for these metrics is already produced by the equipment. The printer records its own print parameters and often its inspection results; the placement machines record feeder errors and placement counts; the AOI records calls and their disposition; the test station records failures by code. The problem is usually that these records live in different systems and are joined by hand, if at all.
The minimum useful integration is a common board identifier and a common time base. With those two, a board can be followed through the line and the station results joined automatically. Where full integration is not available, a simple rule that each station writes its result against the identifier in a shared file achieves most of the benefit. The effort is in the identifier, not in the database. The traceability structure that supports this is the same one the customer will eventually ask for.
Review Cadence and Actions
A metric that is reviewed weekly but acts monthly is a report, not a control. The cadence should match the process: downtime and first pass yield are daily, because the events that move them happen daily; DPPM and the escape rate are monthly, because a single day’s data is too small. Each review should end with a named action and a date, and the action should be recorded against the metric it is expected to move.
The review should also examine whether the metric itself is still measuring what it was designed for. A product mix change, a new station or a change of test coverage can make a previously meaningful figure uninformative, and the definition should be revised rather than the figure argued about. Keeping the definition and its revision history with the report is what allows a comparison across months to remain honest.
FAQ
Should rework be counted as a defect? Yes, in the internal metrics. The rework is evidence that the first pass failed. Counting it keeps the first pass yield honest; excluding it makes the line look capable when it is not, and it removes the defect from the pareto where it would have been actionable.
How is DPPM measured if the customer reports it? As the number of defective units the customer identifies divided by the units shipped, in millions. The internal equivalent is the escape rate from final test, measured by audit. The two should track each other, and a persistent gap points at a test coverage problem.
Is a higher yield always the goal? Not by itself. Yield should be improved at a cost that the product can bear, and a test that catches more defects at the cost of a longer cycle may be the wrong trade. The metric that matters is the total cost of quality, of which yield is one input.


1 Comment
SMT Changeover First Article Verification
[…] corrective action belongs to the setup or to the process. Compare the first article yield with the first pass yield of the run, and treat a large gap as a setup problem until it is proven […]