AOI and X-ray Inspection Coverage Compared
Automatic optical inspection and X-ray inspection are often described as alternatives, and they are not. Each one detects a different class of defect, and a line that relies on only one of them carries a blind spot that is predictable in advance.
Optical inspection sees surfaces brilliantly and hidden joints not at all. X-ray penetrates the assembly and resolves the alloy, but it struggles with the fine detail of a fillet on a small chip part. Knowing which defect each method can and cannot find is what turns two machines into a coverage plan.
What Each Method Sees
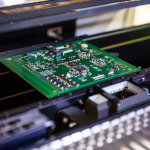
An optical system captures an image of the board from above, usually at an angle as well, and compares features against a programmed reference. It is excellent at finding missing parts, wrong polarity, shifted bodies, insufficient or excessive solder on exposed joints, and the tombstoning that catches the eye immediately.
An X-ray system passes radiation through the board and images the dense alloy inside. It finds voids, insufficient fill in a barrel, bridges under a package and the joint geometry of an area array, none of which an optical camera can reach once the component is in place.
Optical Limits Under a Component
Optical inspection is blocked by anything that stands in the line of sight, and that includes the component itself. A chip resistor shields its own joints from a purely vertical view, while a ball grid array hides every joint completely, so an optical system can only report that the part is present and aligned.
Angled illumination and mirror optics extend the reach to the toe of a fillet on a leaded package, which is usually enough to judge that solder is present. Whether the fillet has the correct shape underneath is beyond the method, and that is the gap the second technology exists to close.
X-ray Transmission and Shadows
An X-ray image is a projection, so features on different layers overlap and can hide one another. A dense plane or a heavy component shields whatever sits beneath it, and the image of a joint may be superimposed on a plane or a neighbouring joint.
Laminography and computed tomography address this by taking several views and reconstructing a slice, which removes most of the overlap. The cost is time per board, so these techniques are usually reserved for a sample, for a first article or for the investigation of a defect that has already escaped other checks.
Voids and Area Array Joints
Voiding is the classic X-ray finding, and the question is always how much void is acceptable. A small void has little effect on a joint that is otherwise well formed, while a large one reduces the load bearing area and can concentrate stress at the interface during thermal cycling.
Most standards set a limit on the total void area within a joint rather than on individual voids, and the limit is expressed as a percentage of the joint area as seen in the projection. That last point matters, because the same joint measured from a different angle gives a different percentage.
Programming and False Calls
Optical inspection lives or dies by its programme, since a system that calls acceptable joints defective will be ignored by the operators within a week. The library has to be taught with real boards from the process, and the limits have to be wide enough to accept normal variation.
False calls are also a symptom rather than a fault of the machine. A high false call rate often indicates that the process itself is unstable, and reducing the calls by loosening limits hides the instability rather than removing it. The same principle applies to any automated check on the line.
Coverage Strategy
The practical arrangement is optical inspection after reflow for visible defects, X-ray for the joints that are hidden, and a defined sampling plan for the expensive technique. The choice of what to sample should follow the defect history rather than a generic rule.
Coverage also has to account for the order of the processes. A board that has been inspected optically and then handled, coated or depanelised can acquire defects after the inspection, so the last check in the sequence should be the one that covers the risks introduced by the later steps.
Escape Rate and Continuous Improvement
The escape rate is the number of defects that reach the customer, and it is the only figure that matters to the buyer. Inspection reduces it, but no inspection catches everything, so the escape rate should be tracked against the defects that inspection did find.
When a defect escapes, the useful question is which method could have seen it and why it did not. That analysis produces a better programme, a different sampling plan or a design change, and it is the same improvement loop that drives the checks described in judging board quality.
Additional Considerations for This Build
Practical attention to AOI pays for itself here, because it decides whether the finished board behaves as the drawing intended. Where the requirement is not stated on the fabrication drawing or in the assembly notes, the shop has to assume a default, and that default is rarely the value the design was simulated with. Stating AOI explicitly, together with the tolerance that applies, removes the assumption and keeps the result predictable from batch to batch.
Deliberate attention to solder joint pays for itself here, because it decides whether the finished board behaves as the drawing intended. Where the requirement is not stated on the fabrication drawing or in the assembly notes, the shop has to assume a default, and that default is rarely the value the design was simulated with. Stating solder joint explicitly, together with the tolerance that applies, removes the assumption and keeps the result predictable from batch to batch.
Process Control and Verification
On a design of this kind, escape rate is the item that decides how the rest of the board is arranged. A short note on the drawing about handling, storage or packaging is often worth more than an extra decimal place on a tolerance. Where a value sits close to a process limit, the drawing should say so, since the shop can then open the process window rather than working to a nominal figure that carries no tolerance.
A stack-up that is drawn rather than described removes most of the ambiguity from a quotation, and it lets the fabricator price the board against the dielectric and copper weights that will actually be used. Where the requirement is not written down, the shop supplies its own default, and the default is chosen for the process rather than for the design.
Related reading: our fabrication notes, board quality and design release notes cover the same ground.
A first article check confirms that the process and the drawing agree on the points listed above, and that the coupon data supports the values used in the design.

Where a measurement falls outside the expected window, the sample is retained so that the cause can be established before the balance of the batch is released.
A first article check confirms that the process and the drawing agree on the points listed above, and that the coupon data supports the values used in the design.

Where a measurement falls outside the expected window, the sample is retained so that the cause can be established before the balance of the batch is released.
FAQ
Can X-ray replace optical inspection entirely? No. It resolves hidden alloy well and surface detail poorly, so defects such as a wrong part or a reversed polarity are missed.
Is 100 percent X-ray worth the cost? For a product with area array packages and a safety requirement it can be, while for a simple board with no hidden joints the same money is better spent on process control.
How are the two results reconciled? By keeping both records against the same board identifier, so that a defect found later can be traced to the method that should have caught it.
Does a low false call rate mean the programme is good? Not on its own. A programme with no false calls may simply be too loose, and the escape rate is the figure that reveals it.