


PCB Control Chart Plan: Laying It Out First
A control chart plan is written before the first panel reaches the printer. It names the parameters to watch, the limits that define normal running, and the person who reacts when a point falls outside them. Getting that structure right at the start saves arguments later, because everyone knows what will be measured and what counts as a fault. This guide covers how to lay out the plan, what to measure, and what a buyer should verify before releasing a build.
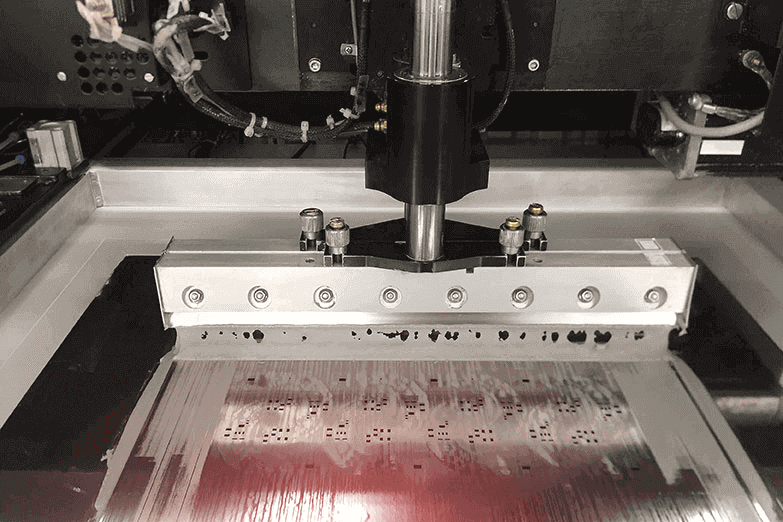
Many quality problems begin as small drifts that nobody recorded. Paste volume creeps up over a shift, a placement offset grows by a few thousandths, and the oven profile shifts after a maintenance visit. Without a chart, those changes stay invisible until defects appear in inspection. A written plan turns them into visible trends, so the line corrects them while the cost is still low. That is the practical reason to build the plan before production, not after the first reject.
What the Plan Covers
The plan is a short working document, not a binder. It lists each critical parameter, the method used to measure it, the sampling frequency, and the response when a reading drifts. It also names the owner for each check, so responsibility does not drift between shifts. A good plan fits on a few pages and gets used daily. If nobody opens it during a run, the document is decoration rather than control.
Scope matters as much as content. The plan should cover the steps that actually vary on your product: paste printing, component placement, reflow, and the inspection that follows. Steps with no meaningful variation, such as a manual assembly operation with a fixed jig, may need only a simple verification. Overloading the plan with checks that never fail wastes operator time and hides the checks that matter. Start with the risky steps and add coverage only where data justifies it.
Choosing Parameters and Limits
Every chart needs a parameter that can be measured as a number. Paste volume, placement offset in X and Y, peak reflow temperature, and time above liquidus are typical examples. Attributes such as solder joint appearance are harder to chart, so they usually belong in inspection records rather than on a control chart. Choose two or three parameters per process step and measure them consistently. Consistency of method matters more than the sophistication of the gauge.
Limits should come from the process and the product, not from a wish. Engineering teams often set a tolerance that the design needs, then confirm the line can hold it during a trial. If the line cannot hold it, the answer is a process change or a design discussion, not a wider limit. Buyers should ask how limits were set and whether trial data supports them. Limits copied from a template without evidence tend to be either too loose to catch problems or too tight to run.
Stackup and Material Effects
Board construction influences which parameters deserve attention. A thick multilayer stackup holds heat differently from a thin two-layer board, so reflow profiles need separate treatment. Copper balance across the panel changes how evenly the board heats, and that shows up as variation between locations. The plan should note these differences and sample from more than one position on the panel. A single measurement point can hide a real problem elsewhere on the same panel.
Materials bring their own variation. Solder paste has a shelf life and a working window, and its viscosity changes with age and storage. Laminates absorb moisture, which affects dimensional stability during reflow. A plan that ignores incoming material control will chase process problems that actually start in the warehouse. Simple rules help: rotate stock, record lot numbers, and check paste condition before loading a printer. These steps cost little and remove a common source of unexplained variation.
Lamination and Reflow Control
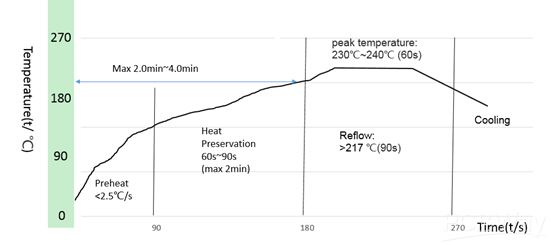
Reflow is the step where small profile errors become visible defects. Peak temperature, ramp rate, and time above liquidus all affect joint formation, and each has a sensible window for a given paste and board. The plan should record the profile at setup and after any oven maintenance. Thermocouple placement should be documented, because a profile measured at the wrong spot tells you nothing useful. Repeat the measurement when the product mix changes to a board with different mass or layer count.
For boards that go through lamination, press cycles deserve similar treatment. Temperature ramp, pressure, and dwell time each influence registration and resin flow. Drifts in these values may not show up until drilling or electrical test, which makes them easy to miss. Recording them on a chart closes that gap. A press operator who sees a trend before it becomes a defect can adjust the cycle and keep the lot inside specification.
Drilling and Imaging Risk
Drill wear is a slow variable with a fast consequence. A worn bit enlarges the hole, damages the barrel, and creates plating problems that appear later as opens. The plan should track drill life against the manufacturer’s limit and record when bits are changed. Hole size checks on a sample basis confirm that the tool is cutting as expected. These checks are quick, and they prevent a whole lot from inheriting a worn-tool signature.
Imaging steps carry registration risk. Layer-to-layer alignment depends on the exposure unit, the artwork, and the panel’s dimensional history. A chart of registration offsets across a lot reveals drift before it reaches the etch or plating stage. When the offsets trend in one direction, the cause is usually tooling or environment rather than operator error. Catching that trend early keeps scrap low and protects the delivery date.
Inspection and Test Coverage
Inspection data feeds the chart, so the two should be designed together. Automated optical inspection reports counts and locations of defects, and those numbers belong in the daily review. Solder paste inspection results give the earliest signal of print drift, often before any joint fails. Electrical test confirms that the circuit works, but it says little about process health. Use each source for what it does best and avoid treating a pass rate as proof that the process is stable.
Test coverage should match the product’s risk. A simple board may need only electrical test and visual check, while a dense assembly benefits from in-circuit test and functional test. The plan should state which tests run, on what sample, and what happens to failures. A clear failure path matters as much as the test itself. Boards that fail and disappear into a rework bin without a record teach the team nothing.
Records and Reaction Rules
A chart only works when someone acts on it. The plan should define reaction rules in plain terms: who checks the chart, how often, and what happens when a point falls outside a limit. A common approach is to stop, verify the measurement, then correct the process before restarting. Without a written rule, operators improvise, and improvised responses vary by shift. Written rules also protect the operator, who can point to the plan when production pressure builds.
Records should be simple enough to keep honestly. A shift log with parameter readings, lot numbers, and any corrective action covers most needs. Store it against the part number so a repeat order starts from a known baseline. If a field return shows up months later, that record gives you the quickest path to the root cause. Factories that keep clean records usually find problems while they are still cheap to fix. During a supplier audit, buyers ought to request a sample record for review.
Working With a Manufacturing Partner
Most product companies do not run their own SMT lines, so the plan is executed by a partner. That makes the handover important. Share the parameters that matter for your product and ask how the partner will chart them. A supplier with a real plan can describe its sampling, its limits, and its reaction rules without hunting for a document. A supplier without one will answer in generalities. The difference shows up in how quickly problems get resolved.
Partner selection should also consider the services around the line. A factory that handles SMT PCB assembly and inspection under one roof keeps data in one place. Component sourcing affects the plan too, because substitutes can change paste and profile behavior; a component procurement process that qualifies alternates in advance avoids surprises mid-build. For early builds, rapid PCBA prototyping lets you test the plan on a small lot before committing to volume.
A documented quality management system should support all of it, and a partner ready for high-volume PCB assembly will already have the records in place.
The takeaway for buyers is simple. Ask for the control chart plan before you place the order, and check that it names parameters, limits, owners, and reaction rules. A plan that fits on a few pages and gets used every shift is worth more than a thick manual nobody reads. Confirm the sampling method and the record format in writing, then review the first lot against the plan. That review tells you more about the factory than any brochure.