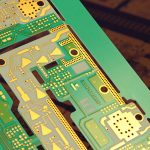
Surface Insulation Resistance Testing Methods Explained
Insulation resistance between two conductors on a bare laminate is theoretically enormous. In practice it is limited by whatever is on the surface: flux residue, handling salts, moisture, or a coating that has not cured. Surface insulation resistance testing measures that surface condition electrically, which makes it one of the few tests that assesses cleanliness and process chemistry together rather than separately.
What SIR Testing Measures
The test applies a voltage between two interleaved conductor patterns and measures the current that flows, from which resistance is calculated. Because the conductors are on the same surface and separated by a small gap, the measured resistance is dominated by the surface rather than by the bulk laminate. A high value indicates a clean, dry surface.
The measurement is sensitive in a way that visual inspection is not. A board can look perfectly clean and still show a low insulation resistance because a thin, invisible film of ionic material is present. That is the situation the test exists to detect, and it is the situation that leads to leakage and migration failures later.
Test Patterns and Comb Geometry
A comb pattern is the standard geometry, consisting of two interleaved sets of fingers with a defined gap and spacing. The pattern maximises the length of the boundary between the two conductors within a small area, which amplifies the leakage current and makes the measurement more sensitive.
Gap width and spacing determine which mechanisms the pattern detects. A narrow gap is sensitive to migration and bridging, while a wider gap emphasises bulk surface leakage. Patterns are usually specified by a standard, and using the same geometry across a qualification programme is what makes results comparable over time. Where the pattern is supplied by the customer, it should be reproduced exactly rather than approximated, because a slightly wider gap changes the measured current by a measurable margin.

Bias Conditions and Voltage
Many test methods apply a bias voltage continuously during the humidity exposure, not only during the measurement. Bias is what drives electrochemical migration, so a test without it detects contamination but not the migration mechanism. The polarity, the voltage and whether the bias is applied between fingers or to a separate electrode all form part of the method definition.
The applied voltage is usually modest, in the range of a few volts to a few tens of volts, chosen to represent the circuit rather than to stress it. Applying a much higher voltage changes the mechanism by promoting electrolytic effects that would not occur in service, which makes the result harder to interpret.
Humidity and Chamber Control
Humidity is the second essential input, because surface conduction requires a water film. The standard conditions are typically eighty-five degrees Celsius and eighty-five percent relative humidity, or a lower temperature with a cyclic profile. The choice of profile determines which mechanisms are provoked, as steady state conditions do not produce condensation.
Chamber control has to be verified rather than assumed, because humidity sensors drift and the atmosphere near the samples may differ from the atmosphere at the sensor. An independent logger placed with the samples confirms that the intended conditions are delivered where they matter, and its record is worth retaining with the test data. A chamber that holds the correct average while swinging widely produces a curve that is hard to compare with a steady state result, even when the nominal conditions match.
Measurement Technique and Timing
Measurement is normally performed at intervals during the exposure using a high impedance meter, with the bias temporarily interrupted. The test voltage used for measurement should be the same as the bias voltage, because the resistance of a contaminated surface is not linear and a different measurement voltage produces a different result.
Timing matters as well. Measuring immediately after the bias is removed captures the wetted state, while waiting allows the surface to dry and produces a higher reading. Standard methods define a delay, and the same delay must be applied to every measurement in a programme, otherwise the comparison between materials or processes is meaningless. Recording the meter model and the measurement voltage alongside the curve removes a variable that is otherwise invisible when two laboratories compare results.

Interpreting SIR Curves
The output of the test is a curve of resistance against time rather than a single number. A healthy sample shows a high initial value that dips slightly as the surface absorbs moisture and then stabilises. A contaminated sample falls much further and may continue to decline as electrochemical activity progresses.
The shape of the recovery after the exposure ends is also informative. A surface that recovers its resistance quickly when dried is contaminated but not permanently damaged, while one that remains low even when dry indicates a conductive residue or actual corrosion of the conductors. Reading the curve is more revealing than noting whether a threshold was crossed.
Common Causes of Failure
Flux residue is the most frequent cause, particularly when a no-clean process has been used with an activity level that was not fully consumed during soldering. Handling salts from bare fingers, residues from plating chemistry, and contamination introduced by an unclean test fixture are the next most common.
Process chemistry problems also show up. Solder mask that has not fully cured can release ionic species during the humidity exposure, and a cleaning process that leaves its own residue can produce a low reading even on a board that was clean beforehand. The test therefore evaluates the whole process rather than a single step. The diagnostic approach resembles that used in short circuit investigation.
SIR and Process Qualification
Because it exercises the combined effect of flux, cleaning and coating, SIR is widely used to qualify a process change. A new flux, a new cleaning chemistry, a change in reflow profile or a new coating material can all be evaluated by running the same pattern through the changed process and comparing the curve with the existing baseline.
The comparison requires the same pattern, the same chamber conditions, the same bias and the same measurement timing. Where any of those differ, the comparison is invalid regardless of how large the difference in the results appears. Establishing a baseline and keeping the method constant is what gives the test its value, and those records belong with the rest of the build documentation described in this guide to the PCB production flow.
Specification and Reporting
A specification should define the pattern geometry, the gap, the bias voltage and polarity, the chamber profile, the measurement intervals, the measurement delay and the acceptance criterion. It should also state whether the criterion applies to the minimum value during the exposure or to the value at the end.
Reporting should include the full curve rather than a single number, together with the chamber record and the process conditions of the samples. That level of detail is what allows a later failure to be investigated meaningfully. The underlying judgement about whether a board is acceptable is the same discipline described in PCB quality judgement.
FAQ
How does SIR differ from ionic contamination testing? Ionic contamination testing extracts residue from the surface and measures what was extracted, which identifies the quantity and species of contamination. Surface insulation resistance testing measures the electrical consequence under humidity and bias, which is closer to the behaviour that matters in service. The two are complementary.
Why is bias applied during the test? Because electrochemical migration requires an electric field. Without bias, a test can reveal contamination but cannot provoke dendritic growth or a leakage path between conductors. The bias condition therefore determines whether the test evaluates cleanliness alone or the full electrochemical risk.
What is an acceptable SIR value? It depends on the standard and on the pattern geometry, but values above one hundred megohms at the end of a humid exposure are commonly required, with a limit on how far the value may fall from the initial reading. The curve shape is often more informative than the absolute number.