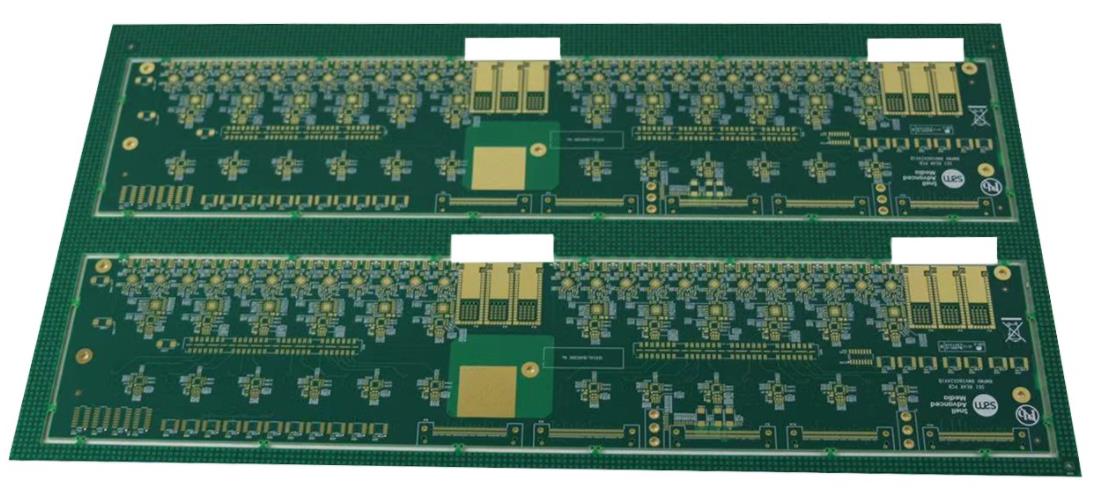
Panel Array Yield Analysis in SMT Production
Yield data is generated at every station, and most of it is thrown away. A defect that is recorded only as a number tells the process engineer that something happened, while a defect recorded with its position on the panel tells them where and often why.
Panel level analysis turns the assembly line into a measurement instrument. The patterns that appear across a panel are created by printing, placement, reflow and handling, and each of those sources leaves a characteristic signature.
First Pass Yield and Its Limits
First pass yield is the proportion of boards that pass every test without rework, and it is the figure that predicts cost. Rework hides defects rather than removing them, so a line with a high rework rate and a good final yield is more expensive than its final number suggests.
The figure should be reported by product rather than by line, because a single difficult product can dominate a monthly number and hide a change elsewhere. Averages over a mixed line are almost always misleading.
Defect Mapping Across the Panel
Recording the position of every defect on the panel outline reveals whether the defects cluster at an edge, along a direction or in the middle. Edge clustering points to conveyor or rail problems, a diagonal pattern points to a print or a squeegee direction issue, and a random spread points to a material or a consumable.
The map is built from the inspection data that is already collected, sorted by position rather than by defect code. The transformation is trivial and the insight is disproportionate, which is why the technique is worth the effort on any line that runs panels.
Placement Defect Patterns
A placement defect that appears in a row across the panel usually follows a feeder or a nozzle, because the machine visits positions in a sequence. A defect that appears in a cluster on one board of the panel points to that board rather than to the machine.
Rotation errors concentrate where a vision system fails to recognise a part, and a systematic offset in one direction across the panel points to a fiducial or a calibration issue. Reading the pattern is faster than checking every setting.
Printing Defects and the Squeegee Direction
Print defects follow the squeegee. A starved aperture at the start of a stroke, a smear at the end and a variation across the panel all indicate that the paste roll was not stable, and the direction of the gradient tells the engineer which end of the stroke was short of paste.
Comparing the first board of a panel with the last is a simple check that separates a stencil problem from a printer parameter problem. This is the same reasoning that applies to the stencil condition described in manufacturing processes.
Reflow Defects and Thermal Gradients
Reflow defects cluster where the thermal history is worst. A component at the edge of a panel heats differently from one at the centre, and a large ground plane changes the local heat demand more than any other feature.
A defect that appears only in one region of the panel is evidence of a thermal gradient, and the answer is usually a change in the panel design or in the profile rather than in the placement machine.
Statistical Process Control
Yield data becomes useful when it is plotted over time with control limits rather than reported as a monthly average. A trend shows a drift before it becomes a rejection, and the control chart is what makes the drift visible.
The measurement should be a rate rather than a count, so that a change in volume does not look like a change in quality. Charts that are not normalised hide the improvement that a volume increase would otherwise produce.
Process Capability Indices
Capability indices compare the spread of a measured parameter with the tolerance it has to meet, and they describe the process rather than the product. A process with a high index produces fewer defects even when the mean drifts.
Where a parameter is measured, the index should be calculated on the measured values rather than inferred from the defect rate, because a defect rate of zero at a small sample size says very little.
Using the Data to Change Something
Yield analysis only pays when it leads to a change. A cluster at a panel edge should change the conveyor setting or the support, a feeder pattern should change the feeder assignment, and a thermal pattern should change the profile.
Recording the change and the following yield is what closes the loop. Without that record, the same analysis is repeated every quarter and reaches the same conclusion.
Reporting and Communication
The report should be short, visual and specific: a panel map, a trend line and one recommended action. A long report of tables is read once and then ignored, while a map is understood at a glance.
The data also has value for the customer and the supplier, since a placement pattern traced to a component tape is evidence that supports a claim. Sharing it early turns a dispute into a joint investigation.
Process Control and Verification
On a design of this kind, placement defect is the item that decides how the rest of the board is arranged. Where a value sits close to a process limit, the drawing should say so, since the shop can then open the process window rather than working to a nominal figure that carries no tolerance. A stack-up that is drawn rather than described removes most of the ambiguity from a quotation, and it lets the fabricator price the board against the dielectric and copper weights that will actually be used.
Where the requirement is not written down, the shop supplies its own default, and the default is chosen for the process rather than for the design. The measurements that matter are the repeatable ones: conductor width and spacing, annular ring, finished hole size, plating thickness and surface finish are all verifiable on a coupon that travels with the panel.
Related reading: our fabrication notes, board quality and design release notes cover the same ground.
Process Control and Verification
On a design of this kind, placement defect is the item that decides how the rest of the board is arranged. Where a value sits close to a process limit, the drawing should say so, since the shop can then open the process window rather than working to a nominal figure that carries no tolerance. A stack-up that is drawn rather than described removes most of the ambiguity from a quotation, and it lets the fabricator price the board against the dielectric and copper weights that will actually be used.
A first article check confirms that the process and the drawing agree on the points listed above, and that the coupon data supports the values used in the design.
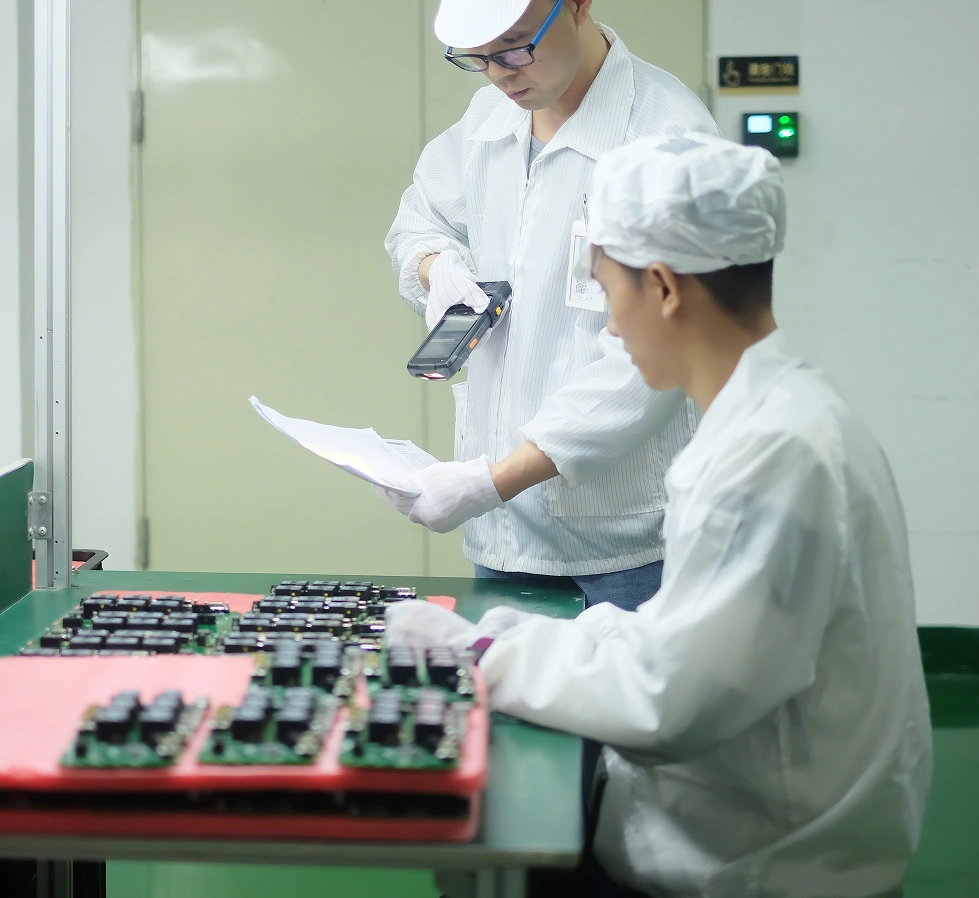
Where a measurement falls outside the expected window, the sample is retained so that the cause can be established before the balance of the batch is released.
A first article check confirms that the process and the drawing agree on the points listed above, and that the coupon data supports the values used in the design.

Where a measurement falls outside the expected window, the sample is retained so that the cause can be established before the balance of the batch is released.
FAQ
Do we need new software for panel mapping? Usually not. The inspection data already contains positions, and a script that groups them by panel location is enough to begin.
How many boards are needed for a trend? Enough to make one unit of change visible, which for a panel process is often a few hundred boards rather than a few dozen.
Is a defect rate of zero a good result? It is only good if the sample is large enough to be meaningful, and the capability index is a better measure of the process.
Should rework be counted as a defect? Yes. Rework is a cost and a risk, and hiding it in the final yield figure removes the pressure that would correct it.