Flex Circuit Push Test Method And Criteria
A flex circuit is thin, compliant and difficult to grip, which makes the strength of its solder joints harder to assess than on a rigid board. A pull test on a component can distort the circuit before the joint fails, and a bend test gives a pass or fail without a number. The shear push test avoids both problems: a tool is driven horizontally against the joint at a controlled height, and the force needed to break it is recorded as a curve.
The method is simple to describe and easy to get wrong. The result depends on the height at which the tool contacts the joint, on the speed of the drive, and on how the sample is held, and those parameters have to be fixed before the numbers mean anything. This article covers the setup and the interpretation.
Why A Push Test Is Used On A Flex Assembly
The test measures the strength of the interface between a component and the conductor beneath it, and it does so in a direction that the joint actually experiences. A flex circuit in a folded product sees shear and peel loads as the assembly moves, not a clean tensile load, so a shear measurement is closer to the service condition than a pull test would be.
It is also a process control tool. Because the result is a number, a shift in the soldering process or in the surface finish appears as a change in the distribution of failures, often before it produces a field return. That makes the test useful at the start of a production run and periodically afterwards, rather than only during a failure investigation.

Shear Height And Why It Changes The Result
The height of the tool above the board surface determines how the load is applied. Contact low on the joint applies almost pure shear, while contact higher up the component adds a bending moment and reduces the force at which failure occurs. Two laboratories using different heights will report different numbers for identical samples, which is the most common reason for a dispute over a test result.
The height should therefore be stated with the result, and it should be chosen to sit within the joint rather than on the component body. A height that is too low risks the tool striking the pad and measuring the adhesion of the copper rather than the solder. A height that is too high risks damaging the component and measuring its strength instead. The window between the two is narrow on a small part, which is why the tool needs fine vertical adjustment.
Reading The Force Displacement Curve
The curve carries more information than its peak. An elastic rise followed by a sharp drop indicates a brittle failure at the interface. A rise that plateaus before falling indicates ductile deformation, which usually means the solder itself yielded rather than the interface. A curve with several steps suggests that the joint cracked progressively, which points at a partially wetted or voided interface.
The displacement at failure is also informative. A joint that fails at a very small displacement has low ductility and will be sensitive to thermal cycling, even if its peak force is acceptable. Reporting the peak alone discards this information, so the curve should be retained with the measurement rather than reduced to a single number.
Sample Preparation And Fixturing
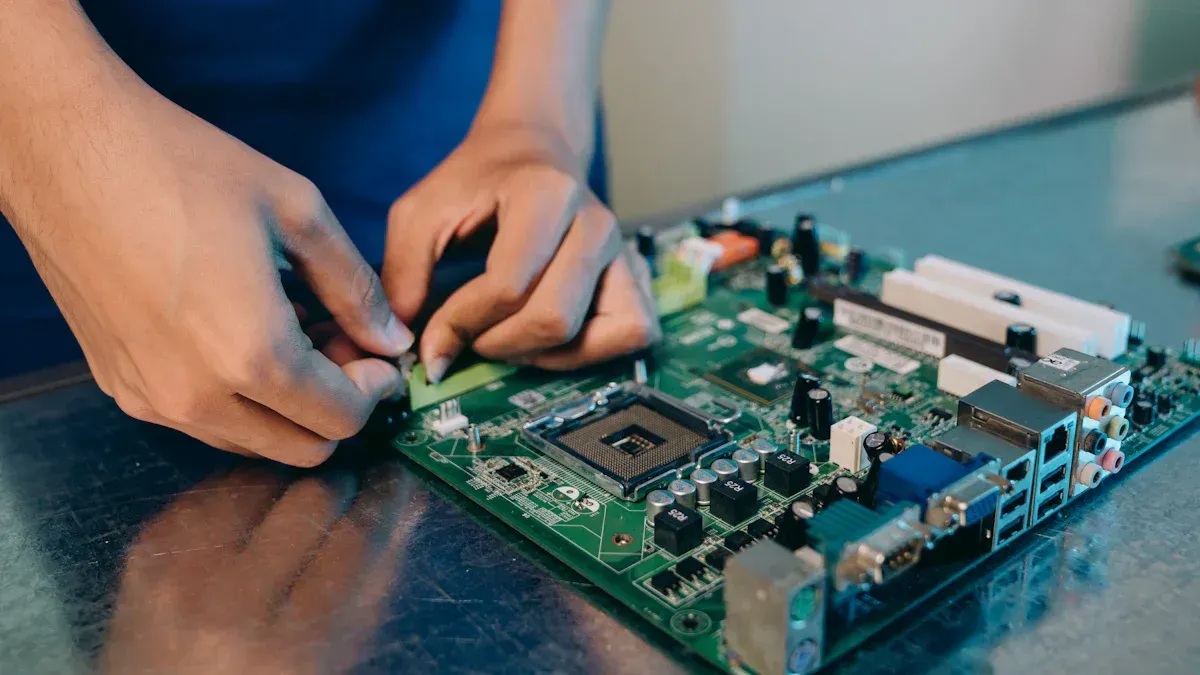
The sample has to be flat and rigidly held during the test. A flex circuit will bend under the tool if it is only supported at the ends, and that bending absorbs energy that should have gone into the joint. Mounting the circuit on a flat backing plate, or clamping it close to the joint under test, removes the compliance of the circuit from the measurement.
The surface should be clean and free of flux residue, because a layer of residue changes the friction between the tool and the component and shifts the apparent strength. The tool itself should be inspected for wear, since a chipped edge concentrates the load and lowers the failure force. The drive speed should be constant across the batch, because the apparent strength of a solder joint is rate dependent.
Acceptance Criteria And Standards
Several published methods describe the technique for different joints. The IPC test method for printed board solder joint strength, the JEDEC ball shear standard and the ASTM method for microelectronic shear strength all define the geometry, the speed and the reporting requirements, and a laboratory should state which one it follows. Following a recognised method makes the number comparable with a supplier’s data and with a previous batch.
The acceptance limit itself is normally derived from a capability study rather than taken from a table. A sample of good joints is tested, the distribution is characterised, and a limit is set below the lower end of that distribution with margin. A limit that is set too close to the mean will reject good product as the process drifts, and one that is set far below the distribution will not detect a real degradation. The same statistical reasoning used in design and quality characteristics applies directly here.
Failure Modes The Test Reveals
The location of the failure is as important as the force. A break through the bulk solder indicates that the alloy and the profile are reasonable. A break at the interface between the solder and the pad indicates a contamination or a finish problem. A break within the component metallisation indicates that the component itself is the weak link, which is a supplier issue rather than a process one.
Recording the failure mode with the force turns the test from a screening tool into a diagnostic one. When several samples fail in the same place, the cause is systematic and can be traced to a process step. When failures are scattered, the process is simply variable. The test is normally run alongside the visual and dimensional checks that form part of an assembly development programme and the mechanical checks covered by board outline and mounting design, since a joint that survives shear but sits on a badly supported outline will still fail in the field.
Process Control and Verification
On a design of this kind, push test is the item that decides how the rest of the board is arranged. The process window is set by the narrowest step in the flow, so an improvement anywhere else shows up as margin rather than as yield until that step is addressed. A short note on the drawing about handling, storage or packaging is often worth more than an extra decimal place on a tolerance.
FAQ
Why do two laboratories report different strengths for the same joint? Almost always because the shear height, the drive speed or the sample support differs. The parameters have to be fixed and reported with the result for the numbers to be comparable.
Is a higher failure force always better? Not necessarily. A joint with a high peak force and little displacement before failure may be less tolerant of thermal cycling than one that yields and deforms.
How many samples are needed? Enough to characterise the distribution rather than a single unit. The limit is set from the spread of the measurements, so a small sample gives a limit with little confidence behind it.