Reading an Eye Diagram: Jitter, Noise, and Signal Quality
Serial links are verified in the frequency domain with insertion loss, and in the time domain with an eye diagram. The second view is often more informative for layout work, because it shows the combined effect of every impairment in the channel at once: attenuation, reflections, crosstalk, and timing uncertainty all reduce the opening that the receiver must sample. Learning to read the shape rather than just the opening height is what turns a measurement into a layout decision.
The concept is straightforward. A pattern generator drives a pseudorandom bit sequence through the channel, and an oscilloscope triggered from a recovered clock overlays many unit intervals on top of each other. Where the transitions agree, the trace is thin and dark; where they disagree, it spreads into a band. The resulting picture resembles an eye, and its dimensions summarize the quality of the link.
How the Diagram Is Constructed
Construction starts with clock recovery. The instrument extracts the bit rate from the data itself, then places a trigger point at every unit interval so that successive bits land on the same horizontal position. Thousands of overlays accumulate into the display. Because the pattern contains every possible combination of bits, the composite includes the worst-case sequences, not just the average behavior.
The measurement therefore depends on the pattern. A short repeating sequence will miss long runs of identical bits that shift the baseline through the AC coupling of the receiver. Compliance testing uses defined patterns precisely because the eye opening changes with the data content, and comparing results from different patterns is meaningless.
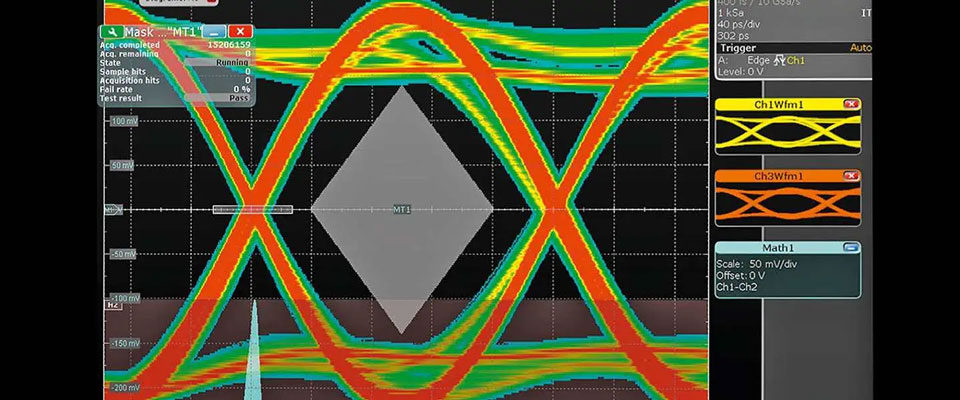
Decomposition is the next refinement. Modern instruments separate the eye into a deterministic component, which repeats predictably with the data pattern, and a random component that follows a statistical distribution. The distinction matters because the two require different fixes.
Rise Time, Overshoot, and Threshold
The basic waveform parameters are read directly from the overlay. Rise time is measured between the ten and ninety percent amplitude points, and it determines how much of the unit interval is available for sampling. A slow edge reduces the horizontal opening even when the amplitude is adequate, which is why excessive capacitance on a trace shows up first as a narrowing eye rather than as a loss of height.
Overshoot and undershoot appear as excursions beyond the settled levels. A moderate amount is normal in a channel with impedance discontinuities, but a large excursion forward-biases the receiver’s protection diodes and can delay or corrupt the next bit. Undershoot is worse in practice, because a dip below the reference can be interpreted as a valid transition and produce a false clock edge or a data error.
Noise and Jitter
An ideal link would produce two horizontal lines. Real links produce bands, and the thickness of those bands is the direct visual representation of jitter and voltage noise. Vertical thickening indicates amplitude noise; horizontal thickening indicates timing uncertainty; and the closing of the eye is the combined result.
Timing jitter comes from many sources. Duty-cycle distortion in the transmitter, power supply ripple that modulates the output buffer, crosstalk that shifts the transition point of a victim line, and the data-dependent delay of the channel all contribute. Because they add statistically, the eye closes gradually as margin is consumed, which is why a link that works at room temperature can fail after the board warms up and the drivers slow down.
Separating the contributions is what makes the measurement actionable. Random jitter sets a floor that cannot be reduced by equalization, while deterministic jitter can often be traced to a specific aggressor or a specific impedance discontinuity and removed by a layout change.
Intersymbol Interference
Intersymbol interference is the effect of one bit on the ones that follow. A long run of identical bits charges the channel and shifts the baseline, so the next transition starts from an offset position and arrives late or early. On the display this appears as multiple distinct traces rather than a single edge, with the spread depending on the preceding pattern.
In a printed channel, intersymbol interference has two main origins. The first is frequency-dependent loss, which attenuates the high-frequency content of a fast edge more than the low-frequency content and spreads the pulse in time. The second is reflection from impedance discontinuities such as connectors, vias, and layer transitions, which produces delayed copies of the signal that overlap subsequent bits. Reducing stub length, tightening impedance control, and shortening the channel all act directly on this mechanism.
Reading Eye Height and Eye Width
Eye height is the vertical opening at the sampling instant, and eye width is the horizontal opening at the decision threshold. Both are compared against a mask that defines the minimum acceptable opening for the specified bit error rate, and a link passes when the measured eye remains outside the mask.
The mask is not derived from a single measurement. The specified bit error rate corresponds to a probability of failure that would take an impractical amount of time to observe directly, so the measurement is extrapolated from the distribution of the timing and voltage histograms. This is why the reported margin can differ between instruments and why the pattern and the measurement bandwidth must be stated alongside the result.
From Measurement Back to Layout
The value of the exercise is the connection between a defect and its cause. An eye that is vertically compressed points to attenuation or to a level mismatch and suggests a material or trace-width change. An eye that is horizontally narrow points to jitter and skew and suggests mismatch in a differential pair or a noisy supply. A split edge with multiple trajectories points to reflections and sends the investigation toward vias, connectors, and impedance discontinuities.
Simulation is the tool that closes that loop before fabrication. A channel model built from the actual stackup can predict the eye for a proposed routing change, and the predicted result can be checked against a measured coupon afterwards. If the prediction and the measurement disagree, the model is missing a mechanism, and that discrepancy is usually more informative than the raw margin. The stackup and layer arrangement that set the channel loss are described in multilayer PCB advantages for high-speed designs. Practical routing rules that improve the measured result are collected in high-frequency trace and data bus routing, and the coupling mechanisms that degrade it are described in the 3W crosstalk rule.
Measurement Practice
Where the probe is placed changes the answer. A measurement at the transmitter output shows a clean eye that says nothing about what the receiver sees; the useful measurement is at the receiver input, after the connector and the full channel. Cable and probe loading must be de-embedded, because a long probe ground lead adds inductance that distorts the fastest edges and creates apparent ringing that does not exist on the board.
The measurement point and the channel configuration also have to be described alongside the result. For a compliant comparison, fix the pattern, the bit rate, the equalization settings, and the sampling bandwidth before comparing anything. Changing one of those parameters between measurements invalidates the comparison, which is a common source of confusion when a link appears to pass on one bench and fail on another.
FAQ
Does a wide-open eye guarantee a working link? No. The eye is measured at a specific measurement point and with a specific pattern. System margin also depends on the receiver’s equalization, the crosstalk from neighboring lanes, and the behavior of the link over temperature and voltage. A large opening is necessary but not sufficient.
Why does the eye change when I change the test pattern? Because the pattern determines which transitions occur. Long runs of identical bits shift the baseline and expose low-frequency effects, while isolated bits expose the full bandwidth of the channel. Compliance patterns are specified so that results can be compared between different labs and instruments.
Can an eye diagram fix a layout problem on its own? It identifies the category of impairment but not the specific location. Locating the cause requires time-domain reflectometry to find impedance discontinuities, or a channel simulation that can be compared against the measurement. The eye tells you that the margin is insufficient; the follow-up measurement tells you why.